Winter Chill and Rainfall measurement as of 16 July 2023
Winter Chill accumulation for 2023 is tracking along the coldest 10% of years for Pome growing districts in WA. This year our first chill portion was accumulated on 14th April at Manjimup and followed by a very cool winter months of June and July with any chill that was accumulated during the night has not been lost, as the daily maximums have rarely gone above 14oC. By mid- July we have accumulated 48 chill portions at Manjimup, with the highest 10% of years at 51.7 and the lowest 10% at 37.7 winter chill portions.
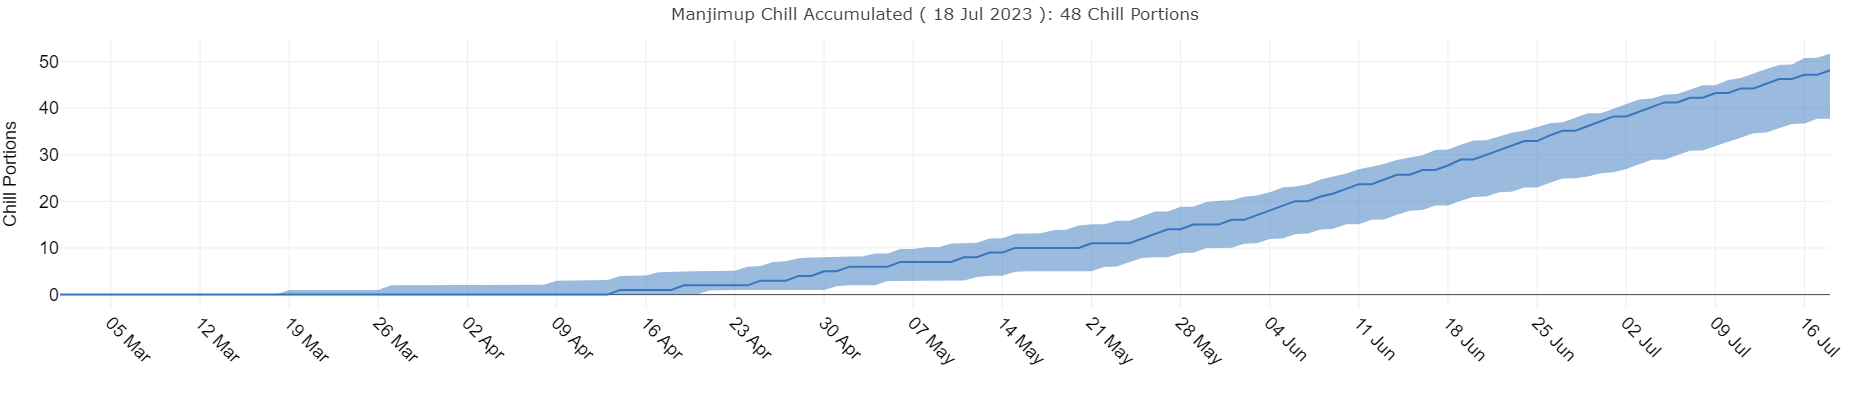
Manjimup Chill Accumulated (18 July 2023) 48 chill portions

Bickley Chill Accumulated (18 July 2023) 45 chill portions

Donnybrook Chill Accumulated (18 July 2023) 35 Chill Portions
The current model used to calculate winter chill is the Dynamic Chill Model. It calculates chill as chill portions based on hourly temperatures. The optimum chilling temperature starts at 6oC, and effectiveness tapers to zero at -2oC and 14oC. Temperatures above 14oC can negate previously accumulated chill. Winter chill calculations start on the 1st of March and finish on the 31st of August using daily minimum and maximum temperatures.
If you would like the calculations done for another Bureau of Meteorology weather station or use another calculation method like chill hours or units, or to update the chill portions calculation at any time click on the button below…
The data presented in the graphical tabs, Chill, Growing Degrees and Temperature, show the average and a shaded area representing the highest 10% and lowest 10% of years. If this is too much information, click on the thick bar object pointing to the left. This will change from compare mode to show only the closest value.
Manjimup still tracking along above average at 48 winter chill portions. Rainfall YTD 477.9mm above average.
Donnybrook still tracking along above average at 35 winter chill portions. Rainfall YTD 296.1mm well below the lowest 10% of years for this time of year.
Bickley still tracking well above average (above the highest 10% years) at 45 winter chill portions. Rainfall YTD 548.4mm just below the median rainfall for this time of year.
Why are there different methods for calculating winter chill?
Many models of winter chill have been developed using the observed effects of temperature on dormancy breaking. The Chill Hours model (Weinberger, 1950) was the first to be developed and estimates winter chill based on hourly temperatures between 0 & 7.2°C. The Chill Units model (Richardson et al., 1974) is slightly more complicated. It incorporates the understanding that temperatures vary in how much they contribute to winter chill and that high temperatures can have an adverse effect. In this model, temperatures below 1.4°C do not contribute to chill accumulation, temperatures between 2.4 and 9.1°C make the greatest contribution and temperatures above 15.9°C have a negative impact.
Knowledge of temperature effects on winter chill has since expanded and the Dynamic chill model (Erez et al. 1990) is the current best practice model, especially in warmer climates. It calculates chill in Chill Portions, based on hourly temperatures. The Dynamic model has many features that capture known temperature-winter chill relationships that are lacking in other models, including the Chill Hours model.
The Dynamic model uses a two-step process. In the first step, an intermediate product is created following a bell-shaped response function to temperature with an optimum at 6°C, tapering to zero at -2 and 14°C. Subsequent warm temperatures can then destroy this intermediate product. The second step is where the intermediate product is banked as a chill portion once a threshold is reached. A chill portion cannot be destroyed regardless of subsequent temperatures. Summing chill portions over autumn and winter estimates accumulated winter chill.
What are the chilling requirements of apple and pear cultivars?
Knowing how much winter chill different crops and cultivars need for healthy flowering and strong yields is essential for growers when deciding what to plant in their region. Failure to suitably match the chilling requirement of a crop or cultivar with the local winter chill will result in reduced productivity. And yet chilling requirements are unknown for many cultivars of apples and pears.
Cultivars are generally ranked in broad groups of 'high', 'medium', and 'low' chill, often based on observations of flowering time in the climate in which they have been grown. Gala apple and Williams' pear are generally considered 'high' chill, Cripps Pink apple and Packham's pear 'medium' chill and tropical apple cultivars such as Anna are in the 'low' chill category. Gaps in understanding of the physiological processes involved in dormancy breaking and a lack of necessary research means that putting actual numbers on these chilling requirements remains difficult.
Some reported chilling requirements include:
34 chill portions for Cripps Pink (Darbyshire et al. 2016)
50 chill portions for Golden Delicious Link in button below
What are the symptoms of inadequate winter chill?
Winter dormancy, although an effective protective measure, can pose production challenges during mild winters when fruit trees do not accumulate sufficient winter chill to meet chilling requirements. Light and variable flowering and a protracted flowering period may result from insufficient accumulation of winter chill. These conditions can markedly affect fruit yield and quality through poor pollination, increased risk of frost damage or by increasing the variability in fruit maturity, making picking more difficult and extending the length of harvest.